
Skip to the investigation
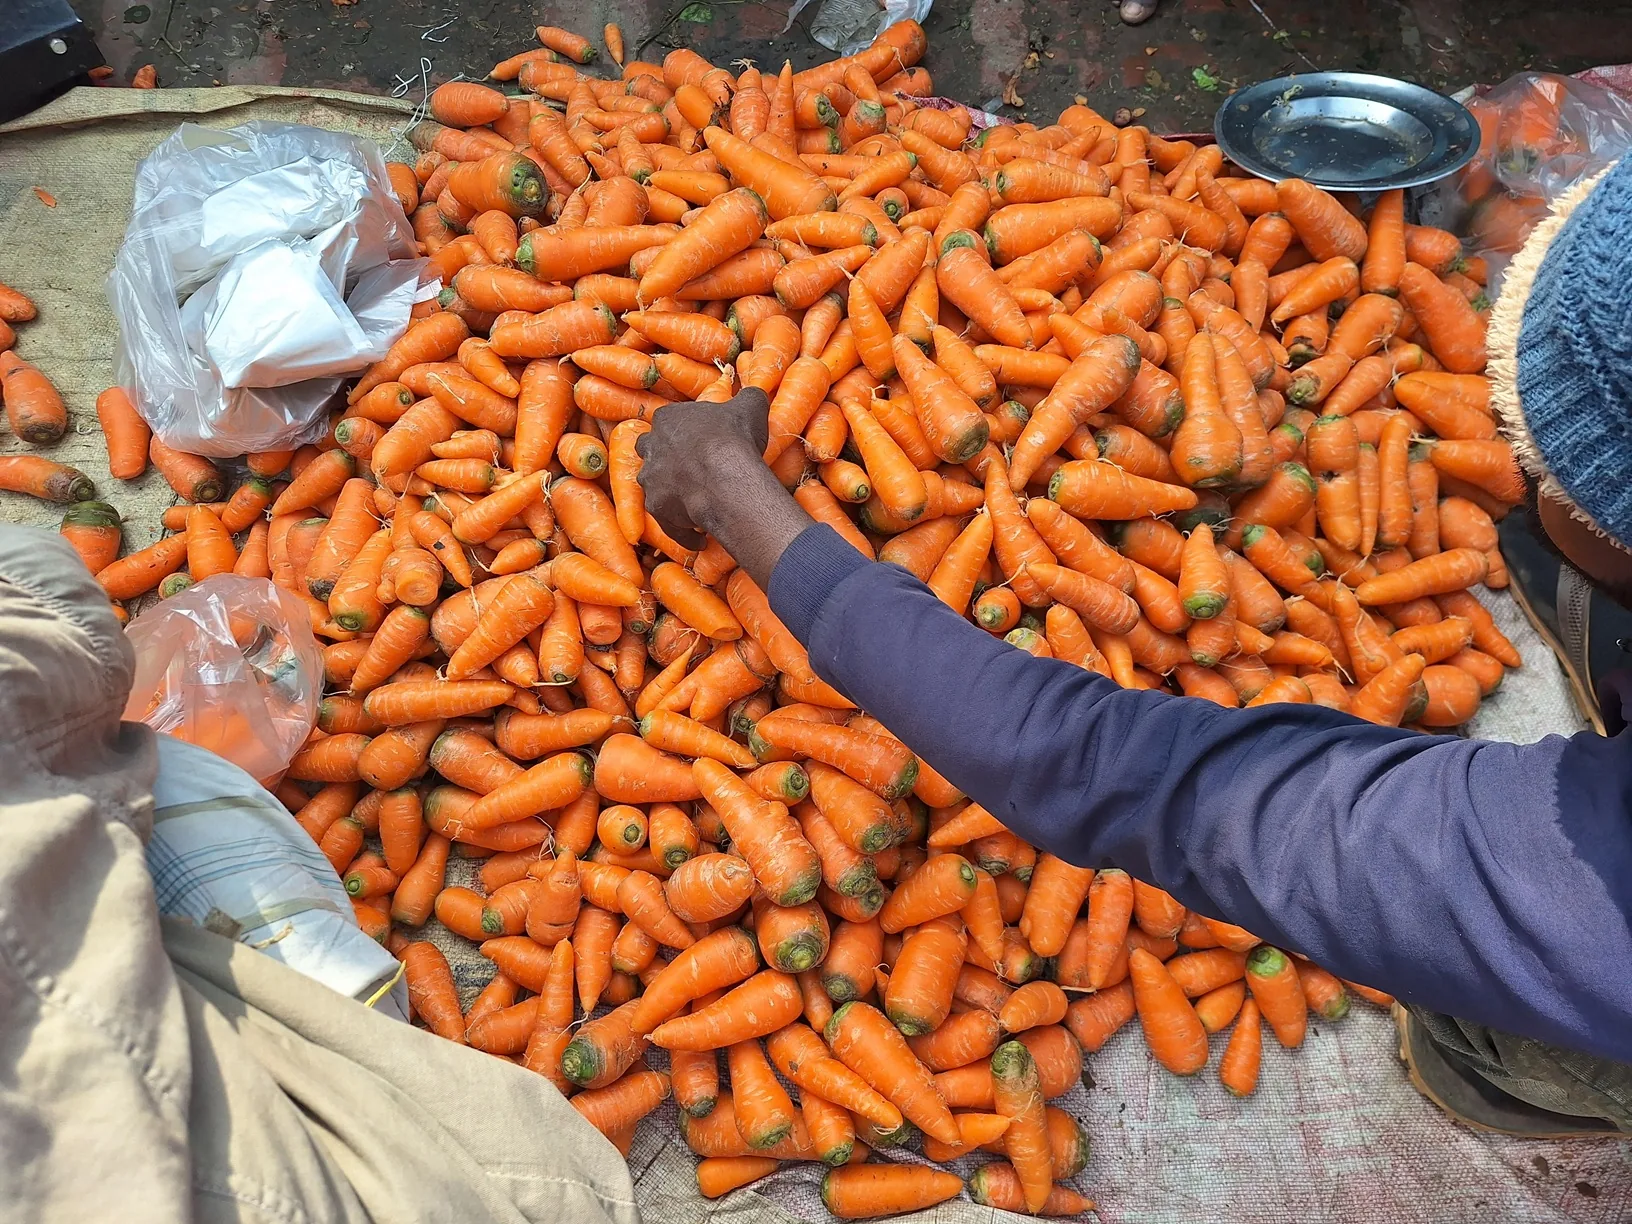
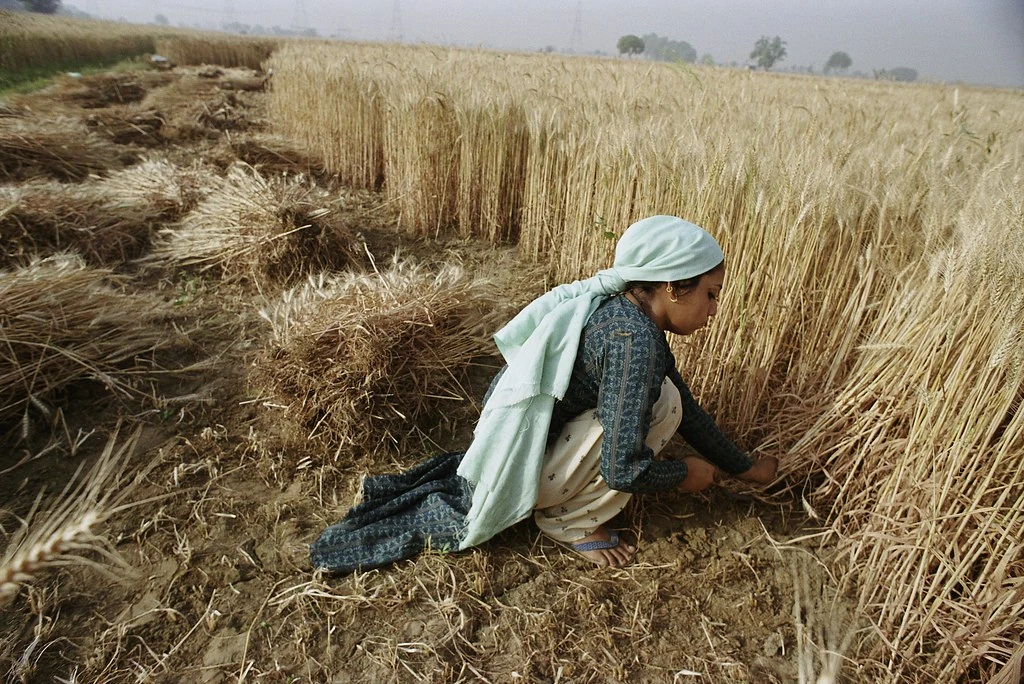
A woman gathers a crop by hand in a field in Bangladesh

Cultivera InsightsRetained Capital

What’s left
for the farmer?

A harvest tells us what came off the land. This investigation asks what can make the next planting possible.

Bangladesh · Evidence essay · 2024–25

Begin with the record

Bangladesh · Scott Wallace / World Bank · archive photograph published 2014

Enough left
to begin again.

A harvest can become sale proceeds, food kept at home, a payment against a loan, or resources for the next planting. Those are not interchangeable.

Retained Capital starts with 22 wheat crop years from Jashore and Kushtia. The record shows what changed in production. The investigation asks what remained available for the farmer to begin again.

02 / The crop record

Jashore + Kushtia · 2003–04 to 2024–25

Wheat on
shrinking ground.

Yield rose. The wheat footprint shrank faster.

Width = wheat area · Height = recorded yield · Rectangle = indexed output · 2003–04 = 100

Cultivera Crop IntelligenceSource data · Bangladesh Bureau of Statistics
22 annual observations · Jashore + Kushtia

Read the object · width = area · height = recorded yield · rectangle = output
Wheat area100.0
Recorded yield100.0
2003–04
Area × yield ÷ 100 = output100.0 × 100.0 ÷ 100 = 100.0
2024–25Area 43.2
Yield 164.3
Output 71.0

02 / The crop record

Wheat on
shrinking ground.

Yield rose. The wheat footprint shrank faster.

Jashore + Kushtia · 22 annual observations.

2016–17Area fell from 19,217 ha to 8,644 ha during the period in which wheat blast affected southwest Bangladesh.
164.3yield index
43.2area index
The crop record cannot tell us what remained with the people growing it.Source data · Bangladesh Bureau of Statistics agricultural statistics · assembled and harmonised by Cultivera Crop Intelligence.
GeographyJashore + Kushtia
Period2003–04 → 2024–25
UnitIndex · 2003–04 = 100
RecordBBS source data · Cultivera assembly
Cultivera Crop Intelligence
Bangladesh district Atlas
03 / The geography
Official records · national geometry
districts in the Cultivera Atlas
One system · crop and period coverage varies
Cultivera Atlas: 64 districts with Jashore and Kushtia highlightedAll 64 Bangladesh district boundaries are shown. Jashore and Kushtia are highlighted only to locate the wheat record; colour does not encode production quantity or intensity.BagerhatBandarbanBargunaBarishalBholaBograBrahmanbariaChandpurChapainawabganjChattogramChuadangaCox’s BazarCumillaDhakaDinajpurFaridpurFeniGaibandhaGazipurGopalganjHabiganjJamalpurJashoreJhalokatiJhenaidahJoypurhatKhagrachhariKhulnaKishoreganjKurigramKushtiaLakshmipurLalmonirhatMadaripurMaguraManikganjMeherpurMoulvibazarMunshiganjMymensinghNaogaonNarailNarayanganjNarsingdiNatoreNetrakonaNilphamariNoakhaliPabnaPanchagarhPatuakhaliPirojpurRajbariRajshahiRangamatiRangpurSatkhiraShariatpurSherpurSirajganjSunamganjSylhetTangailThakurgaonKushtiaJashore

Where the wheat
record sits.

The map locates the wheat record in Bangladesh. All 64 district boundaries remain visible; only Jashore and Kushtia are highlighted. Colour is locational and does not encode production intensity.

Source data · Bangladesh Bureau of Statistics2024–25 district wheat estimates · assembled and harmonised by Cultivera Crop Intelligence

Geometry: Cultivera Atlas · Record: BBS Yearbook of Agricultural Statistics 2025 · Locator only

04 / The household account

National household survey · May 2025

What harvest income
has to cover.

Between harvest and the next planting, food, treatment and repayments can compete for the same cash. A separate national survey shows the wider pressure, without linking these results to the households behind the wheat record.

Average per household · BDT per month

Income and expenditure

Bottom 40%National household group

Tk2,506expenditure above income

Middle 40%National household group

Tk909expenditure above income

Top 20%National household group

Tk7,733income above expenditure

The differences are between group means. They are not every household’s deficit or surplus, a debt balance, or a measure of retained capital.

PPRC, Economic Dynamics and Mood at Household Level in Mid-2025, slide 17 · 8,067 completed household interviews · Inspect the cited extract ↗

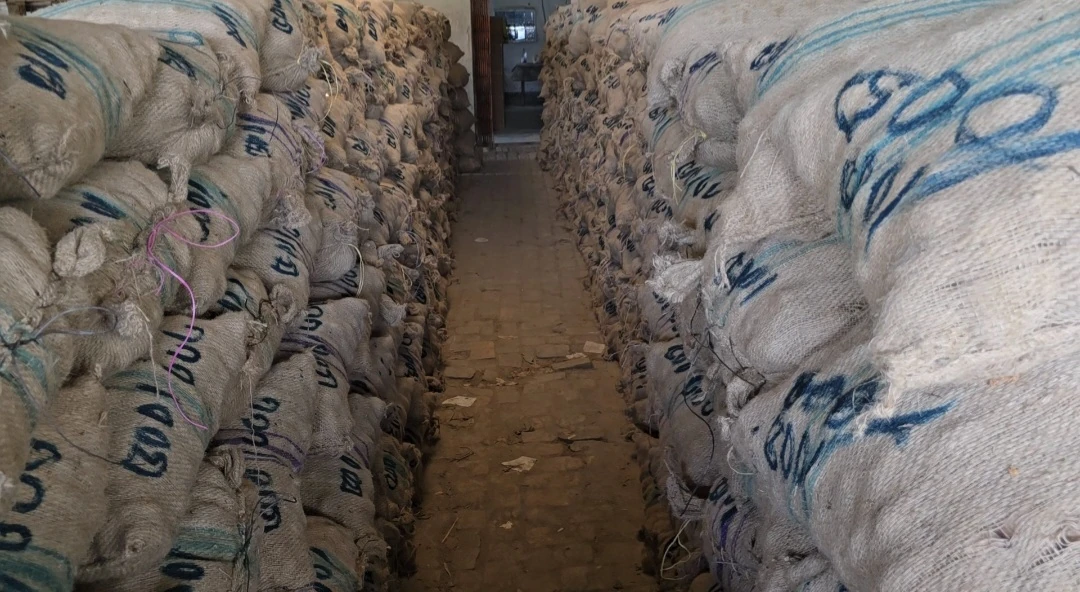
Sacks of potatoes stacked along an aisle in Faridpur
Potato storage · Faridpur · documentary context, not the worked example’s observed farm.

05 / The price of time

Illustrative worked example · not a forecast

01 · Sell today

Waiting
has a price.

A later sale has to recover more than today’s price. It must also cover carrying costs and any saleable crop lost while waiting.

02 · Carry

Cash to recover later

Tk1,400
Tk1,000 harvest value+ Tk400 carrying cost

Waiting adds Tk4/kg of illustrative carrying cost to the original 100 kg lot.

03 · Physical loss

Crop remaining

95 kg
95 kg available to sell5 kg illustrative loss

The cash target rises while the quantity available to recover it from falls.

04 · Break-even

This example resolves to

The later price required simply to recover the illustrative Tk1,400 from the 95 kg that remains.

Illustrative assumptions · harvest price Tk10/kg · carrying cost Tk4/kg on the original 100 kg · 5% physical loss · not an observed farmer result · not a forecast

In this example, waiting only works when the value gained exceeds the cost of getting there.

06 / The route to sale

Public purchasing · route and condition

Who can sell
to the state?

Processing and quality requirements sit inside the route to the state buyer. Access to that route determines whether announced support can become a farmer’s sale.

National procurement snapshot

How the recorded crop entered procurement

Boro · through 2 September 2026 · physical rice-equivalent intake

Illustrative image · AI-generated for Cultivera · raw paddy / bagged grain texture · not evidence Documentary context · rice drying, Dhamrai · Azimronnie (Azim Khan Ronnie) · 8 Nov 2022 · CC BY-SA 4.0 · not evidence of procurement route

The shares compare physical intake routes on a common rice-equivalent basis. They do not measure budgets, margins, rejection, or farmer exclusion.

Ministry of Food dated intake record ↗

The procurement mix shows the route taken. It does not, by itself, explain why.

Separate evidenceDifferent geography · different claim · no causal link
Overhead view of a worker among long rows of rice drying in Dhamrai

A separate reported delivery condition · Bagerhat, 2026

The 14% threshold

In reporting on Bagerhat’s 2026 Boro procurement drive, paddy was required to be at or below this moisture level. Drying takes work, time and access to a suitable surface or service.

Meeting a condition of sale can itself consume time.

CommodityPaddy
Reported condition≤14% moisture

Evidence boundary: this Bagerhat condition is shown separately from the national procurement mix. It is not a national rejection rate and does not explain the 22.5% / 77.5% intake split.

Rice drying, Dhamrai · Azim Khan Ronnie · 26 March 2019 · CC BY-SA 4.0 · documentary context.

Route and condition are both visible. The evidence still does not tell us which households could meet the condition, who was rejected, or why the national route split took the shape it did.

Cultivera Insight

Proposed mechanism · warehouse finance

Finance against
stored crop.

Accredited storage, credible grading and an acceptable receipt can support finance against post-harvest inventory. The producer retains ownership while the crop is stored; sale proceeds can settle charges and debt before any balance returns to the producer.

Proposed mechanism. This diagram describes a proposed operating arrangement. It does not establish that warehouse-receipt finance is currently available to the growers in this investigation. Eligibility, repayment, charges, storage loss and price risk remain.

08 / Warehouse finance

Cultivera Insight · Mechanism and limits

The debt
is still due.

A receipt can connect physical stock to a lender. It does not remove storage costs, credit terms or the possibility that sale proceeds are too low.

Conditions that remain

  • EligibilityBorrower, crop, warehouse and receipt must be acceptable.
  • RepaymentAn advance is cash now and a liability until settled.
  • ChargesStorage, handling and finance costs accumulate under agreed terms.
  • LossQuality and saleable quantity can change while crop is held.
  • PriceA later sale does not guarantee a higher net return.

Mechanism references: IFC Global Warehouse Finance Program ↗ · FAO warehouse-receipt finance review ↗. These references establish a general mechanism, not current availability or impact in the wheat districts.

09 / Productive capacity

Retained capital What remains usable when another production decision has to be made

Capacity carried forward

What remains usable
for another season

The next planting also depends on resources that remain physically usable.

SoilWaterWorking assets

Capacity carried forward

Productive capacity

The next crop starts
before planting.

Higher yield does not show whether soil, water access or working assets were maintained. These resources belong alongside the financial account, in their own physical measures.

Physical condition

Soil

Crop totals do not show whether the productive base was maintained, depleted or improved.

Access and cost

Water

Availability and the cost of a service shape what can be planted and when.

Usable capacity

Working assets

Equipment and access to services can remain useful after the crop leaves the field.

The retained-capital question therefore extends beyond cash: what productive capacity is still usable when the next decision arrives?

Workers handle bagged produce during aggregation and loading in Bangladesh.

10 / Services around production

After harvest

One more
option open.

Drying in time, reaching another buyer and accessing equipment all require usable services when the producer needs them.

01Dry in time
02Reach another buyer
03Access equipment

A service matters when it keeps a real choice open.

Conceptual bridge · no measured sequence is implied

Produce handling context · Cultivera image archive.

10 / Operating register

A service matters only when it can be used in time.

Drying, procurement access and equipment hire are different services. Each has to work through a viable operator, transparent terms and a clear failure test.

Dry · local aggregation

Put quality within reach.

Locate shared drying where arrival volumes, travel time and power supply can support a reliable service. Keep grade measurement visible from the first weighing.

Operator
Contracted local enterprise or accountable producer organisation; publish beneficial ownership.
Payment
A posted charge by weight and moisture, with receipts separating water loss, service cost and quality deductions.
Failure test
Queue time, contamination, downtime and drying losses. Require an alternative service route when equipment fails.

Sell · direct procurement access

Separate the grower payment from processing.

Test direct purchase from verified cultivators with drying and milling bought as transparent services. Compare farmer net receipts and total public cost on the same rice-equivalent basis.

Public buyer
Announces quantity, quality, price, delivery windows and a clear rule for oversubscribed allocations.
Service provider
Competes for drying, transport and milling contracts with disclosed fees, recovery rates and ownership.
Payment trail
A receipt links the cultivator, lot, accepted weight and actual payment. Assisted access and an appeal route accompany digital enrolment.

Hire · custom hiring centres

Hire equipment when it is needed.

Custom hiring centres can pool equipment demand across farms. Their value depends on a machine arriving when needed, an affordable complete tariff and an operator who can maintain the fleet.

Before purchase
Map service demand, season overlap, travel, operator skills and break-even utilisation. Site irrigation services against local hydrogeology.
At every booking
Publish fees, queue priorities and cancellations. Track service time and downtime with auditable records; telemetry can support those records.
After payment
Fund a maintenance escrow and disclose its use. Audit related-party bookings, concentration of access, complaints and operator solvency.

Retained-capital test

The service earns its place when the producer retains more after all its costs.

Proposed mechanisms. These operating conditions identify what a pilot should make visible and test; they do not establish that access already exists.

11 / The missing record

Across the season

What the records
still cannot answer.

The available sources observe different populations, units and moments. None follows the same farming household from before production to the next planting.

District crop record
Area · production · yieldUnit · district × crop year
Household survey
Income · expenditure · reported pressureUnit · household × survey period
Procurement record
Commodity condition · delivery routeUnit · commodity / procurement period
Enterprise census
Capital sources · economic unitsUnit · economic unit × census period

Different units can illuminate the same problem. They cannot be stitched into a household history they do not contain.

Evidence limit

Same household: not observed.

Across the evidence assembled for this investigation. The missing link is continuity through time for the same household.

Proposed minimum longitudinal record

Follow the same household
through three moments.

Follow the same consenting household from before production, through harvest, to the next planting. These are prospective observations, not a result already measured.

01 / Before Starting position Cash, debt, productive assets and household obligations before production.
02 / After harvest What changed Income, stored crop, spending, repayments and the choices available after harvest.
03 / Next planting What remains Resources, liabilities, household needs and the viable decisions still open.

Measurement status · Proposed, not yet observedAvailable sources do not connect these three observations for the same household.

11 / The missing record

Across the season

What the records
still cannot answer.

The available sources observe different populations, units and moments. None follows the same farming household from before production to the next planting.

District crop recordArea · production · yield · district × crop year
Household surveyIncome · expenditure · reported pressure · household × survey period
Procurement recordCommodity condition · delivery route · procurement period
Enterprise censusCapital sources · economic units · census period

Evidence limit

Same household: not observed.

Different units can illuminate the same problem. They cannot be stitched into a household history they do not contain.

Proposed minimum longitudinal record

Same farming household · three moments

  1. BeforeStarting position
  2. After harvestIncome, stored crop, spending and repayments
  3. Next plantingResources, obligations and household needs

Six questions

What must be observed next?

These questions preserve the current Retained Capital measurement logic after the evidence gap is made visible.

  1. 01 / Cash

    Cash for planting

    How much working cash remained for the next season?

  2. 02 / Debt

    Debt outstanding

    What borrowing was still outstanding, and was emergency finance required?

  3. 03 / Time

    Time to sell

    Could the producer choose when to sell within the options actually available?

  4. 04 / Productive capacity

    Usable resources

    What assets and productive resources remained usable?

  5. 05 / Household wellbeing

    Household needs

    Were food or treatment forgone to preserve working cash or productive assets?

  6. 06 / Choice

    Choices open

    What viable decisions were still open when next season began?

Fieldwork

Follow the same consenting households before intervention, after harvest and at next planting. Keep return, cash availability, liabilities, productive capacity and household wellbeing separate.

Use the field checklist ↗
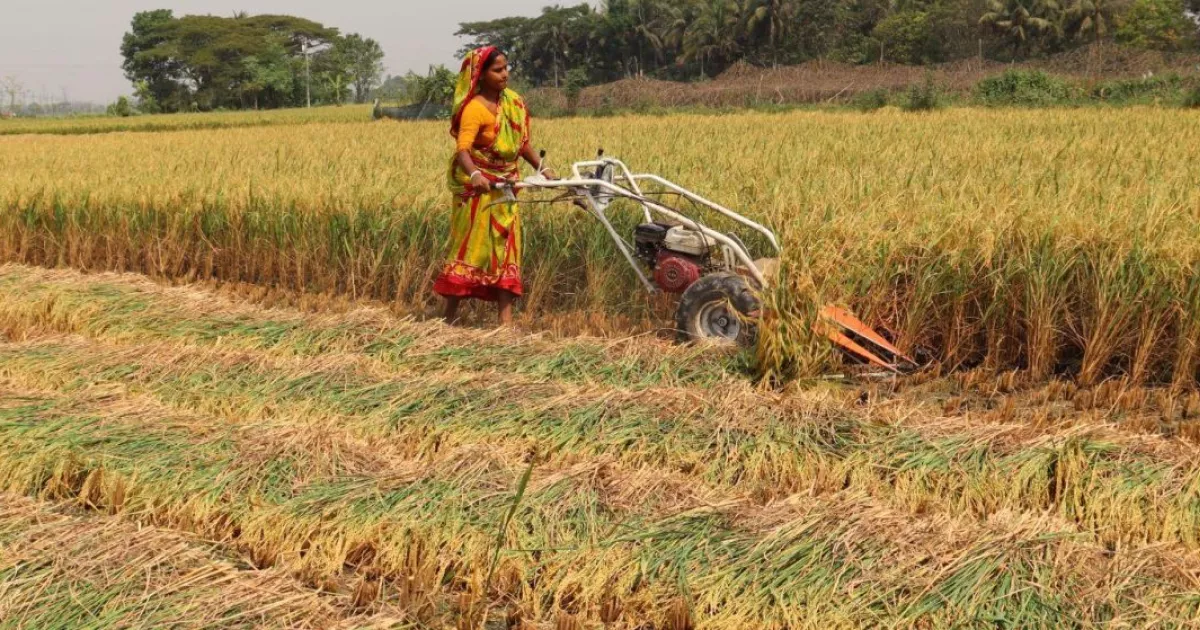
A woman operates a power reaper in a paddy field in Batiaghata, Bangladesh.

The retained-capital test

Enough left
to begin again.

Less emergency borrowing. A machine repaired. A crop held on workable terms. Water available next season. A cultivator able to choose the next buyer.

That is the result agricultural policy should make visible.

Download the whitepaper PDF ↓

Equipment at work · Batiaghata, Bangladesh · IRRI / CGIAR, 2024. Documentary context for access to farm services.

Cultivera Crop Intelligence · data provenance

The source
records.

Source data · Bangladesh Bureau of Statisticsassembled and harmonised by Cultivera

The crop record shows where and when production changed. Producer definitions, household evidence and the enterprise Census add different views. They do not form one linked household account. Different populations. Different measures. Read separately.

Evidence families · 04 Crop records Producer definitions Household survey Enterprise Census
One recorded observation Source specimen · underlying crop record Wheat · Jashore · 2024–25

Place

Jashore

Crop

Wheat

Area1,218 ha
Production4,630 t
Yield3.80 t/ha

Official source

Bangladesh Bureau of Statistics. Yearbook of Agricultural Statistics 2025, 2024–25 wheat estimate table.

Harmonised record

Cultivera Crop Intelligence. Official records assembled and harmonised for comparison across crop years and districts.

How the figures were compared

Comparable records

Wheat area and production are summed across Jashore and Kushtia for each crop year before aggregate yield is calculated. All 22 years remain observed; no missing value is converted to zero.

Separate evidence

National household means, the Bagerhat moisture condition, national procurement intake, the irrigation study and general warehouse-finance references use different populations, geographies and periods.

What remains unknown

The sources do not establish opening or closing cash, liabilities, household withdrawals, sale terms or asset changes for the wheat growers.

Cultivera Crop IntelligenceWorking records · official sources and transformations

Reading Room

Source documents, figure downloads and notes on how the evidence was used.

08files

10source notes

03field moments

Downloads

Source notes

Official records + household context

01Bangladesh Bureau of Statistics · crop records

The wheat series uses BBS district estimates from 2003–04 to 2024–25. Area and production are summed across Jashore and Kushtia before aggregate yield is calculated. The locator map uses all 64 exact paths in the Cultivera Atlas; highlight indicates location, not production intensity.

The crop records are official source data. Cultivera Crop Intelligence harmonises and presents them for comparison across crop years and geography.

02BBS · producer definitions

Income and Productivity of Small-Scale Food Producers Survey 2025, published June 2026. Pages 62–63 define agricultural revenue and net income; page 88 defines the preceding 12-month reference period. Revenue includes noncash output; net income excludes depreciation.

The definitions help distinguish production, revenue and income. They do not provide next-season cash for the households represented in the wheat record.

03BBS · rural economic units

Economic Census 2024, National Report, Volume I, March 2026. Table 5.4 reports the main source of capital by economic-unit type and locality.

The aggregate tables describe economic units rather than the crop-farming households in this investigation. They do not isolate farmers or agricultural service providers.

04PPRC · national household context

Economic Dynamics and Mood at Household Level in Mid-2025, national dissemination presentation dated 25 August 2025. Fieldwork ran 8–31 May 2025; 8,067 household interviews were completed. Slide 17 supplies income-group means; slide 41 supplies the reported financial-crisis incidence.

These are national survey results, not households linked to the wheat record. Group means are not every household’s balance, savings or retained capital. The cited slides do not report subgroup sample sizes or uncertainty intervals.

Models + mechanisms

05Waiting model

The displayed break-even later price is a worked example: (Tk10 sale now + Tk4 incremental carrying cost) ÷ 95% saleable crop remaining = Tk14.74 per kilogram remaining for sale. It is not a price forecast.

Model, assumptions and limits (JSON)

06Procurement route

The 14% moisture condition comes from reporting on Bagerhat’s 2026 Boro procurement drive. The national intake shares use a separate Ministry of Food snapshot through 2 September 2026 and convert paddy to rice-equivalent at 65%. Neither figure is a rejection rate.

Bagerhat report ↗ · Ministry intake record ↗

07Warehouse finance

IFC and FAO references support the general mechanism: eligible commodities stored in an acceptable warehouse can secure financing through a warehouse receipt or equivalent arrangement. Legal, institutional and lender requirements vary.

This essay does not establish availability, terms, uptake or farmer impact in Jashore or Kushtia. IFC program description ↗ · FAO review (PDF) ↗

08Solar irrigation study

IWMI’s January 2026 evidence summary reports 20–30% lower irrigation costs for fee-for-service solar irrigation compared with diesel at study sites in northwest Bangladesh, using 2021–23 observations. It reports no significant adjusted difference in water application.

The range is irrigation cost, not whole-farm cost or an outcome for the wheat growers. IWMI evidence summary ↗

Publication + method

09Photography

Photographs provide documentary context; none depicts a surveyed household or a grower linked to the crop series. Rice drying is by Azim Khan Ronnie, Dhamrai, 26 March 2019, licensed CC BY-SA 4.0. Other image credits are retained in their nearby captions or source metadata.

10Method and publication limits

Observed records, reported context, derived figures, a worked example and proposed mechanisms keep distinct labels. Production evidence is not used to infer household earnings, liquidity or wealth. Documentary photographs are not treated as observations.

Cultivera uses computational and AI-assisted methods to examine source records. Published figures are checked against their cited records; uncertainty and missing observations remain visible.

Fieldwork

Following households through a season

Tools for recording the same-household account this investigation cannot observe in the available sources.

Use the field checklist ↗
  1. Before.Record the household’s starting position before the season.
  2. After harvest.Record income, stored crop, spending and repayments.
  3. Next planting.Check resources, obligations and household needs again.
Evaluation method

Follow the same consenting households before intervention, after harvest and at next planting. Record return, cash availability and productive capacity separately. Record borrowing alongside its repayment obligation, and identify any food or treatment forgone to preserve cash or assets. Where sample sizes and the evidence support it, compare results by holding size, tenancy, gender, location and programme exposure.